
Galaxy Retail Solutions
OUR
SERVICES
“We love to travel and can operate in many African Countries”
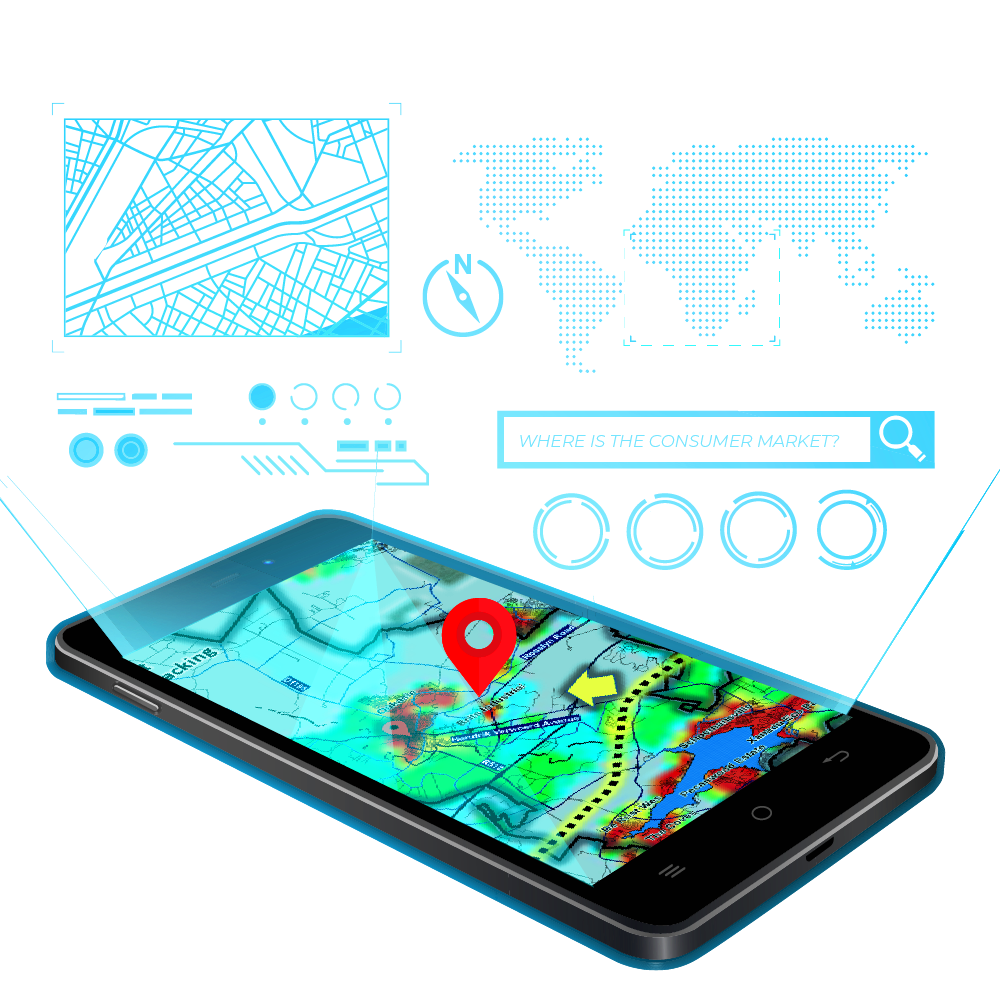
OUR SERVICES
- Demographic Assessments in association with Geo Terra Image (GTI)
- Independent Retail Site Evaluations
- Retail Location Allocation Strategies: Where to open stores, where to close and relocate also known as a Country Development Plan)
- Target Market Analysis
- Competitor Analysis
- Retail Performance Benchmarking
- Bespoke Retail Consulting Service
- Risk Management / Market Intelligence
- Retail Store Network Planning “GAP–Analysis”
- Medical feasibility Studies: Hospitals, Day Hospitals, specialised medical, Clinics, and Primary Health Care facilities.
- Customer Tracking and Retail Impact Analysis: using Cell data Tracking in association with MAP IT,
- Feasibility Studies for Retail Developments in association with Research Matrix and Urban Studies
- Site Procurement Support in association with KC Consulting (Site Procurement Specialists)
- Marketing Support: Penetration Analysis, customer tracking within shopping malls – APEX or High Activity Analysis (Available across Africa)
- Franchise Demarcation and Feasibility Studies in association with Franchise Fundi


Independent Site Evaluations and Demographic Potential
“To check if a site is viable and what turnover we can expect”
- Orientation of the site is relative to competition and the market.
- Mapping (Geo-coding) of existing Synergy Brands and Competitor Stores.
- Catchment Delineation uses a Gravity Model. Or based on Cell data tracking for MapIT. This is a computer algorithm that we use to assist with the catchment demarcation and to simulate the impact of any nearby existing outlets or other prominent Competitor Brands or actual support based on Cell data movement over a period of 12 months.
- A Benchmark Model will be used that is calibrated for each individual retail brand/client will be used for Turnover Estimates based on the underlying Market potential for the client’s brand (GTI 2021/22 Demographic data).
- The Galaxy Retail Report will also include proposed developments to simulate the Growth potential and the impact on the proposed store Turnover.
- We also love to travel to check if the site is suitable for the intended purpose (Many locations appear better on paper)

Location Allocation Strategy
“To decode the most optimal store expansion plan given the historical performance of the brand, prevailing market conditions, future trends, and competitor activity.”
The key component of the Location Allocation strategy is the benchmarking section which is aimed to expose how the business performs at a variety of different types of locations. Benchmarks are essential to the interpretation of store performance, whilst providing the scientific foundation to compare locations using an analogue model. Performance benchmarking is also the main guide that underpins the store proliferation strategy and potential forecasting.
Some of the key indices that will form part of the benchmarking will include:
- Internal Benchmarks (based on performance data)
- External Benchmarks (secondary data – Demographic Data and Cell data Tracking)
Galaxy Retail will then calibrate a new Demographic Expenditure Model for the client by using the latest available internal and external data which will be used in conjunction with activity indicators to, firstly determine a Market Share for Existing Outlets as part of the performance benchmarking and secondly to screen areas for GAPs (Part of the GAP Analysis).
This will all be linked to store classification that will be based on three components:
- Urban Status:
i.e. Metropolitan City, Town, & Rural - The Nature of the Location:
CBD, Industrial, Auto Node, Suburban, Emerging Market, or SACSC Retail Classification. - Store Format:
Destination, Warehouse, Retail/Standard, Online
Individual stores will be assessed, and a Location allocation strategy will be formulated for the client, which will guide the GAP Analysis. In basic terms, the benchmarking will draw attention to key type store classifications and the type of areas to target or to avoid.

GAP Analysis
“To identify realistic opportunities for new stores, proactively based on tested models, a data-driven Location Allocation Strategy, and competitor locations. ”
- For Store acquisitions or Greenfield opportunities.
- The methodology for the Metros & Cities is different from towns and more rural areas. Metropolitan catchments are more localized whereas town / rural catchments are large and based on the sphere of influence of a town. Some types of locations such as CBD locations in Metros and Cities are not directly linked to a catchment and are dependent on commuter inflow.
- We include Expenditure Potential Thematic Maps for the metros and largest Cities to indicate the main Nodes. This will guide us to search for locations.
- Each Metro / City GAP will be accompanied by a generic catchment to determine a Generic TO Estimate for the client.
- We will use our new Sphere of Influence Layer (populated with the latest 2021/2 GTI Demographic Data) to create a seamless layer for all Towns & larger Rural areas in SA.

Demographic Data • Lifestyle Data • Geographical Data
Our Data Sets
Galaxy has access to all of the latest data sets in the market in association with:
- Demographic Data
- Lifestyle Data: NLI – Neighbourhood Lifestyle Index
- Geographical Data
Galaxy Retail Solutions PTY LTD is in partnership with GeoTerra Image. The data set we use is the 2021/2 NLI – Neighbourhood Lifestyle Index. The data is updated on a regular basis by some of the country’s top statistical/demographic experts. Various large organisations and local and international organizations make use of this demographic set.
We have remodeled it to be used as a demographic forecasting tool with input from industry specialists concerning Household Consumption. We have models for the most prominent Retail Expenditure Categories.
The models are frequently updated to align with inflation and prevailing market conditions such as the impact of load-shedding and the migration to online retailing.
Cell-phone Tracking (Visitation Analysis)

Galaxy Retail Solutions PTY LTD is in partnership with MapIT. One of the most optimal methods available is to track customers and potential customers is cell data tracking. Most people are using smartphones.
People are constantly on the move and mobility demands new ways of assessing consumer behaviour. Every time you open an app the data is recorded, collected and processed according with POPIA Compliance in a non-personal manner. A typical Visitation analysis involves many thousands of unique cell data users that have visited a particular location or site or shopping Centre. The data allows for a profile of where the people are coming from, and going after leaving the site, the time of day and day of the week.
Galaxy Retail use this data this dataset to determine the sphere of influence of a Site under review (South Africa and Africa).
The key question to ask is how customers use the site?
This implies two parts (1) the Origin and Destination of customers, to understand how far customers are traveling and also (2) To determine the level of inflow that must be added to the local catchment or area of support.
In order to achieve this we are using the latest fact-based technology to determine, with 100% accuracy, the flow of people to and from the site under review. We use cell data tracking to track unique cell IP addresses of customers that supported the proposed site over a 12-month period.
As mentioned, the tracking complies with the Protection of Personal Information Act (POPI Act) of South Africa. No personal info is captured. The tracking only records the unique IP address using data & app usage while within the selected “polygon“ or premises.
The cell tracking support pattern is a good indication of what the Client can expect from a customer behaviour perspective. We use the outcome of the cell tracking to guide the catchment delineation, which is a very important part of any site assessment.
Our Methodology
Market Potential Indicators
- Geo-Positioning & Format Grouping stores
- Trade Area Analytics (Current Stores) – Main Route Analysis & Customer Spotting (Cell Data or Deliveries) – adhering to POPI guidelines
- Customer Profiling – Potential Modelling, or
- Lifestyle Analysis & Market Penetration, or
- Consumer Risk Analysis (Credit Data Analytics) – adhering to POPI guidelines
- Competitor / Synergy Mapping – Activity Indicators
- Other Activity Generators – Shopping Centres, or
- Day-time & Night-time population / Cell phone Activity
Data provided by
GeoTerra Image, Galaxy Retail & MapIt
Spatial Data Analysis
- Aerial Photography Inspection & Field Survey
- Node activity and proximity of competitors/synergy
- Classify nodes based on Geographic location and Type of Location
Opportunity or Risk Identification • GAPs
- Based on initial data and analysis, potential opportunities to expand or convert stores can be identified and prioritised.
- The outcome will guide and focus the Site Sourcing process (identifying available sites).



Independent Site Evaluations and Demographic Potential
“To check if a site is viable and what turnover we can expect”
- Orientation of the site is relative to competition and the market.
- Mapping (Geo-coding) of existing Synergy Brands and Competitor Stores.
- Catchment Delineation uses a Gravity Model. Or based on Cell data tracking for MapIT. This is a computer algorithm that we use to assist with the catchment demarcation and to simulate the impact of any nearby existing outlets or other prominent Competitor Brands or actual support based on Cell data movement over a period of 12 months.
- A Benchmark Model will be used that is calibrated for each individual retail brand/client will be used for Turnover Estimates based on the underlying Market potential for the client’s brand (GTI 2021/22 Demographic data).
- The Galaxy Retail Report will also include proposed developments to simulate the Growth potential and the impact on the proposed store Turnover.
- We also love to travel to check if the site is suitable for the intended purpose (Many locations appear better on paper)

Location Allocation Strategy
“To decode the most optimal store expansion plan given the historical performance of the brand, prevailing market conditions, future trends, and competitor activity.”
The key component of the Location Allocation strategy is the benchmarking section which is aimed to expose how the business performs at a variety of different types of locations. Benchmarks are essential to the interpretation of store performance, whilst providing the scientific foundation to compare locations using an analogue model. Performance benchmarking is also the main guide that underpins the store proliferation strategy and potential forecasting.
Some of the key indices that will form part of the benchmarking will include:
- Internal Benchmarks (based on performance data)
- External Benchmarks (secondary data – Demographic Data and Cell data Tracking)
Galaxy Retail will then calibrate a new Demographic Expenditure Model for the client by using the latest available internal and external data which will be used in conjunction with activity indicators to, firstly determine a Market Share for Existing Outlets as part of the performance benchmarking and secondly to screen areas for GAPs (Part of the GAP Analysis).
This will all be linked to store classification that will be based on three components:
- Urban Status:
i.e. Metropolitan City, Town, & Rural - The Nature of the Location:
CBD, Industrial, Auto Node, Suburban, Emerging Market, or SACSC Retail Classification. - Store Format:
Destination, Warehouse, Retail/Standard, Online
Individual stores will be assessed, and a Location allocation strategy will be formulated for the client, which will guide the GAP Analysis. In basic terms, the benchmarking will draw attention to key type store classifications and the type of areas to target or to avoid.

GAP Analysis
“To identify realistic opportunities for new stores, proactively based on tested models, a data-driven Location Allocation Strategy, and competitor locations. ”
- For Store acquisitions or Greenfield opportunities.
- The methodology for the Metros & Cities is different from towns and more rural areas. Metropolitan catchments are more localized whereas town / rural catchments are large and based on the sphere of influence of a town. Some types of locations such as CBD locations in Metros and Cities are not directly linked to a catchment and are dependent on commuter inflow.
- We include Expenditure Potential Thematic Maps for the metros and largest Cities to indicate the main Nodes. This will guide us to search for locations.
- Each Metro / City GAP will be accompanied by a generic catchment to determine a Generic TO Estimate for the client.
- We will use our new Sphere of Influence Layer (populated with the latest 2021/2 GTI Demographic Data) to create a seamless layer for all Towns & larger Rural areas in SA.

Services
What Can We Do For You?

Robotic Installation
Praesent sapien massa, convallis a pellentesque nec, egestas non nisi. Donec sollicitudin molestie malesuada. Sed porttitor lectus nibh. Vivamus magna justo, lacinia eget consectetur sed, convallis at tellus.

Automation & Efficiency
Praesent sapien massa, convallis a pellentesque nec, egestas non nisi. Donec sollicitudin molestie malesuada. Sed porttitor lectus nibh. Vivamus magna justo, lacinia eget consectetur sed, convallis at tellus.

Research & Development
Praesent sapien massa, convallis a pellentesque nec, egestas non nisi. Donec sollicitudin molestie malesuada. Sed porttitor lectus nibh. Vivamus magna justo, lacinia eget consectetur sed, convallis at tellus.

Smart Device Control
Praesent sapien massa, convallis a pellentesque nec, egestas non nisi. Donec sollicitudin molestie malesuada. Sed porttitor lectus nibh. Vivamus magna justo, lacinia eget consectetur sed, convallis at tellus.

Hardware & Software Training
Praesent sapien massa, convallis a pellentesque nec, egestas non nisi. Donec sollicitudin molestie malesuada. Sed porttitor lectus nibh. Vivamus magna justo, lacinia eget consectetur sed, convallis at tellus.

Premium Customer Service
Praesent sapien massa, convallis a pellentesque nec, egestas non nisi. Donec sollicitudin molestie malesuada. Sed porttitor lectus nibh. Vivamus magna justo, lacinia eget consectetur sed, convallis at tellus.
Testimonials
Pellentesque in ipsum id orci porta dapibus. Nulla quis lorem ut libero malesuada feugiat. Curabitur arcu erat, accumsan id imperdiet et, porttitor at sem. Nulla porttitor accumsan tincidunt. Donec rutrum congue leo eget malesuada. Lorem ipsum dolor sit amet, consectetur adipiscing elit. Vivamus suscipit tortor eget felis porttitor volutpat. Vestibulum ante ipsum primis in faucibus or
Pellentesque in ipsum id orci porta dapibus. Nulla quis lorem ut libero malesuada feugiat. Curabitur arcu erat, accumsan id imperdiet et, porttitor at sem. Nulla porttitor accumsan tincidunt. Donec rutrum congue leo eget malesuada. Lorem ipsum dolor sit amet, consectetur adipiscing elit. Vivamus suscipit tortor eget felis porttitor volutpat. Vestibulum ante ipsum primis in faucibus or
Blog
Resources & News
Hello world!
Welcome to WordPress. This is your first post. Edit or delete it, then start writing!
Get Started
It’s Never Too Late or Too Early to Get Started
Lorem ipsum dolor sit amet, consectetur adipiscing elit, sed do eiusmod tempor incididunt ut labore et dolore magna aliqua. Ut enim ad minim veniam.